Intel Core i9 11900K and Core i5 11600K review: calm before the storm
Two powerful new processors, but these chips don't rock the boat.

It's finally here - Intel's 11th-generation of desktop CPUs. Codenamed Rocket Lake S, these chips aim to re-take the gaming performance crown from AMD, whose recently released Ryzen 5000 processors showed incredible gen-on-gen gains. Intel is making similar claims, touting up to a 19 per cent improvement to single core speeds, but does 11th-gen deliver? To answer this, we've been testing the flagship Core i9 11900K (£559/$614) and mid-range Core i5 11600K (£269/$269) frantically for the past week, in a new suite of recent games that can trip up even flagship CPUs.
Before we get into the results, let's take a moment to ponder exactly how Intel are able to make these bold performance claims. As we established in our 11th-gen desktop processors article, these chips use Intel's familiar 14nm process - one that's formed the basis of their desktop CPUs since their Broadwell fifth-generation Core processors in 2015. Since then, Intel has optimised the heck out of this particular lithography, and this time they're doing so by 'back-porting' features from their new 10nm laptop chips. This is cheaper, from a research and development standpoint, than moving to a whole new process, but it still involves a gargantuan effort from the engineering team.
To shore up their offering, Intel has also debuted a few new features with its 11th-gen chips. One that we're most excited by is called Adaptive Boost Technology (ABT), which aims to push clock speeds higher as long as the CPU isn't hitting a limit of some kind, such as power or thermals. AMD's Ryzen chips operate under a similar principle, allowing them to wring out some extra performance under good cooling solutions, and there's no reason that Intel's take on the idea wouldn't have similarly good results. Unfortunately, this ABT feature is only available on the most expensive Core i9 11900K and Core i9 11900KF chips, rather than being a feature of the lineup in general, but it's still a nice inclusion that deserves some additional testing - look for that on page six of this review.
11th-gen also arrives alongside new 500-series motherboards, unlocking PCIe 4.0 support out of the box and allowing RAM overclocking on a wider range of chipsets. We won't spend too much time here covering motherboard features, as Z590 boards have been available for a little while now, but we'll cover the potential performance impact of RAM overclocking in more detail on the fifth page of this review.
| Processor | Cores/Threads | Base Clock | Single/All Core Turbo | TDP | Cost* |
|---|---|---|---|---|---|
| Core i9-11900K | 8/16 | 3.5GHz | 5.3GHz/4.8GHz | 125W | $539 |
| Core i9-11900 | 8/16 | 2.5GHz | 5.2GHz/4.7GHz | 65W | $439 |
| Core i7-11700K | 8/16 | 3.6GHz | 5.0GHz/4.6GHz | 125W | $399 |
| Core i7-11700 | 8/16 | 2.5GHz | 4.9GHz/4.4GHz | 65W | $323 |
| Core i5-11600K | 6/12 | 3.9GHz | 4.9GHz/4.6GHz | 125W | $262 |
| Core i5-11600 | 6/12 | 2.8GHz | 4.8GHz/4.3GHz | 65W | $213 |
| Core i5-11500 | 6/12 | 2.7GHz | 4.6GHz/4.2GHz | 65W | $192 |
| Core i5-11400 | 6/12 | 2.6GHz | 4.4GHz/4.2GHz | 65W | $182 |
Note*: Note: We've omitted 'F' and 'T' processors from this chart to aid readability; more info here. Intel's published prices refer to lots of 1000; consumer retail prices (as used in the text) will necessarily be higher, potentially much higher due to the ongoing semiconductor shortage.
For now, let's take a quick look at the test rig we'll be working with and content creation performance, before we get into the game benchmarks proper.
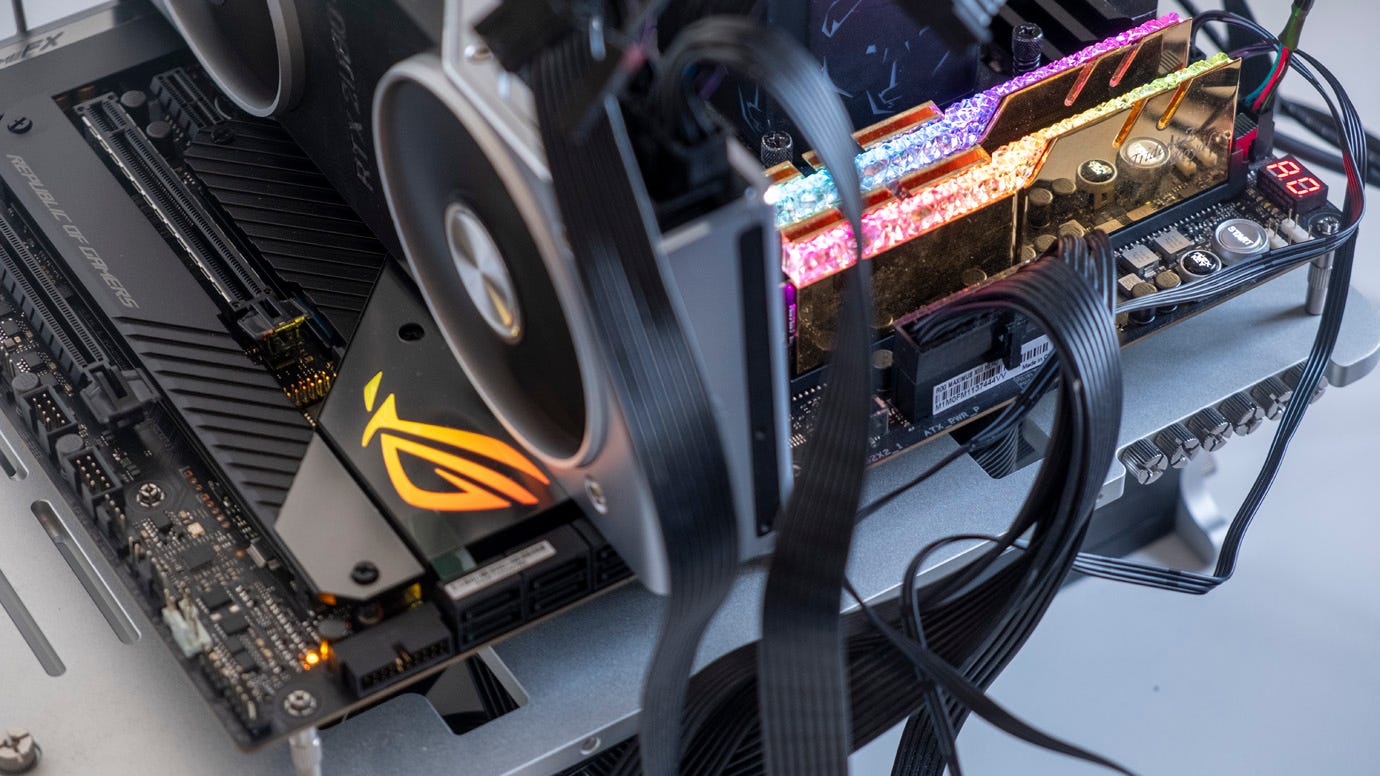
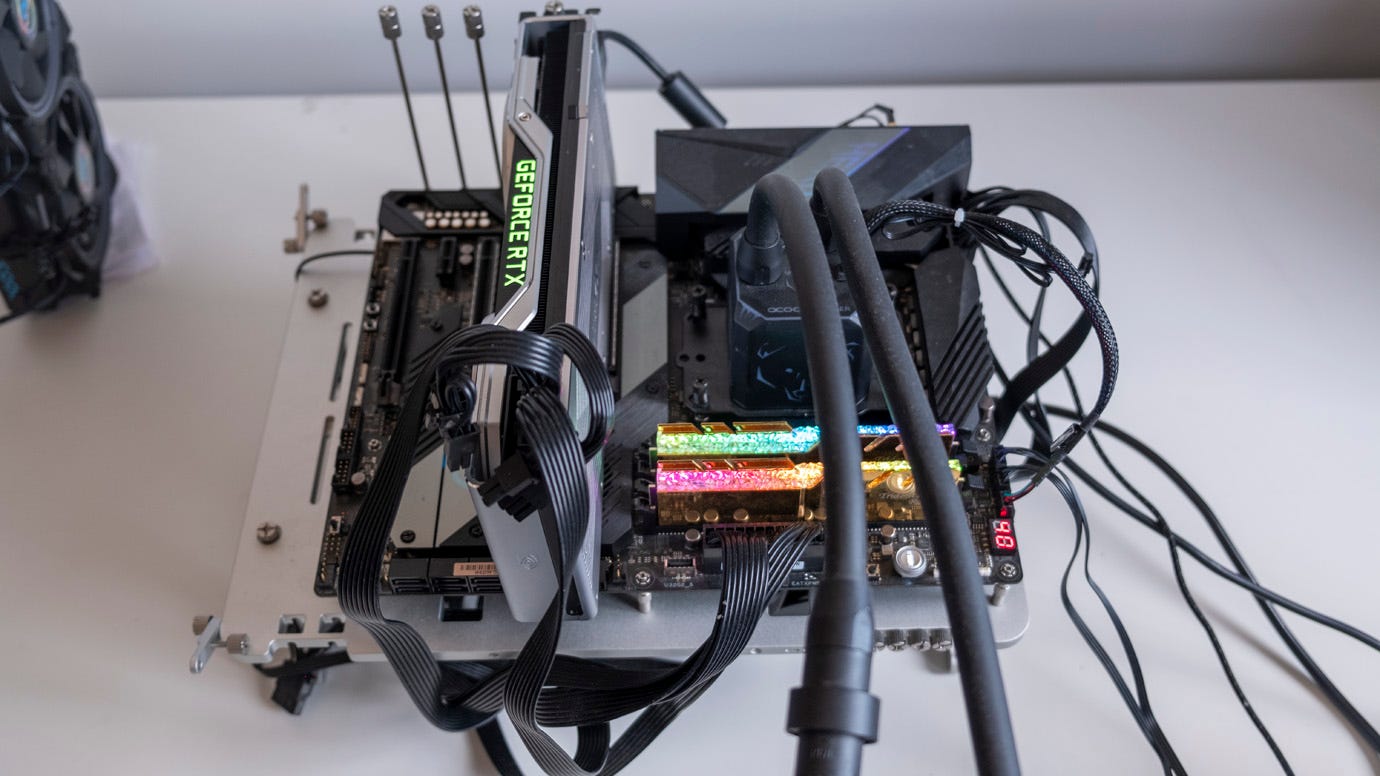
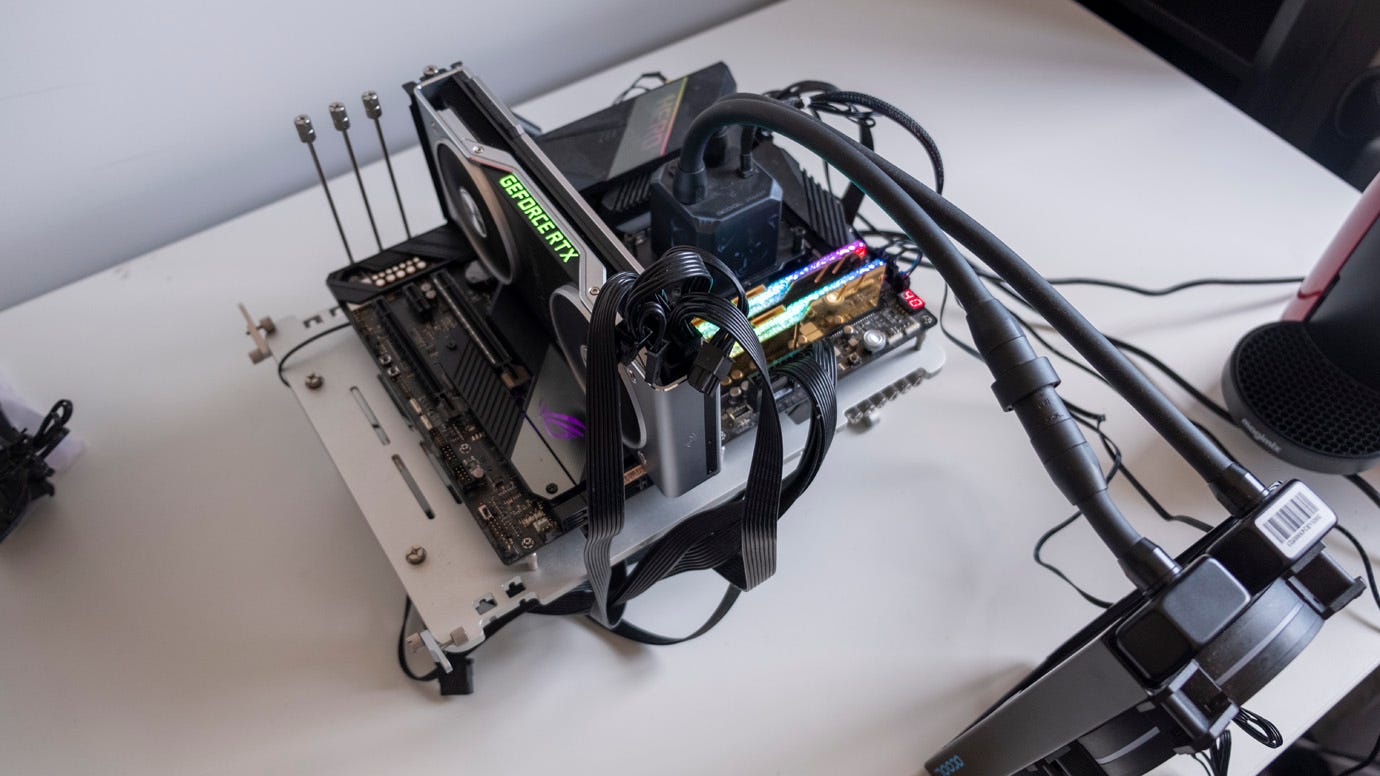
We paired our processors with an Nvidia RTX 2080 Ti Founders edition, as RTX 30-series graphics cards remain in short supply - even for tech journalists! We may revisit these tests with an RTX 3090 in future, which could allow us to see similar CPU differences while using higher graphical settings in some games (eg Cyberpunk 2077, Total War Three Kingdoms and Call of Duty Black Ops Cold War) and just higher margins in general in others.
We used Intel's provided Asus Z590 ROG Maximus Hero 13 motherboard for testing Intel CPUs, and the Asus Crosshair 8 Hero for testing the AMD CPUs. Otherwise, we used G.Skill Trident Z Royal 3600MHZ CL16 RAM at XMP/DOCP settings, an Eisbaer Aurora 240mm AiO for cooling both Intel and AMD CPUs, an 850W 80+ Gold Gamer Storm PSU and a 2TB Samsung 970 Evo Plus NVMe SSD from Box. The latest Windows updates and Nvidia graphics drivers were installed, while our Z590 board used the latest available BIOS provided by Intel at the time of testing (version 610).

It's important to note that we tested with Multi Core Enhancement (MCE) enabled, meaning Intel's stock turbo and power limits are not enforced. We've tested fairly consistently on Asus boards in the past, but it does mean that motherboards that either follow Intel's guidance more closely or relax different settings can produce different results, especially with regards to power consumption. Furthermore, Intel Adaptive Boost was on for the bulk of our testing and the motherboard was set to Gear 1 mode (meaning there's a 1:1 relationship between the clocks of the integrated memory controller (IMC) and RAM). This reflects a typical use case scenario for a high-end processor, where the user will be accepting the default motherboard options to enable extra performance, and matches our previous testing methodology for CPUs.
However, you should know that this does mean that the CPUs operate outside of Intel's turbo duration limits, using more power and producing more heat, so you will need to factor in the cost of a reasonable motherboard, good power supply and a strong cooling solution to get similar results. With the stock limits enabled, you should expect slower performance in any workload that exceeds the normal turbo duration limit of 56s.
So, with that proviso out of the way - content creation. We've opted for two relatively quick tests here, to give you the broad strokes of how 11th-gen performs for common tasks like 3D rendering and transcoding video from one format to another. For the former, we used Cinebench R20, a benchmark application that mimics rendering a 3D scene in professional graphics package Cinema 4D, while for the latter we encoded a high-quality Patreon video into h.264 and h.265 (HEVC) formats using the free Handbrake application.
Cinebench tests both single and multi-threaded performance, which can make it a useful predictor of later gaming performance - for example, a CPU that boasts a high single-core score here is likely to do well in games that rely on a single thread for the bulk of their computation, like Far Cry 5. Intel promised a substantial single-core performance boost, and that's borne out - both CPUs we have in house score 600 points or higher in the single-core, which is around 90 points higher than their immediate predecessors and right in line with AMD's Ryzen 5000 designs.
The multi-threaded scores should also benefit from the IPC advantage in 11th-gen, but the 10900K outperforms the 11900K here - that's because Intel chose to step back from ten to eight cores with their new flagship design. However, the 11600K saw no such reduction in core count, so it gets to enjoy a healthy 741 point advantage in the multi-threaded render task, a 20 per cent boost that's right in line with Intel's guidance.
| CB R20 1T | CB R20 MT | HB h.264 | HB HEVC | HEVC Power Use | |
|---|---|---|---|---|---|
| Core i9 11900K | 636 | 6209 | 42.92fps | 19.60fps | 390W |
| Core i5 11600K | 599 | 4328 | 31.00fps | 13.97fps | 233W |
| Core i9 10900K | 545 | 6337 | 45.55fps | 19.43fps | 268W |
| Core i5 10600K | 493 | 3587 | 26.40fps | 11.84fps | 177W |
| Core i9 9900K | 520 | 5090 | 37.87fps | 16.22fps | 266W |
| Core i7 9700K | 486 | 3759 | 28.77fps | 13.12fps | 171W |
| Core i5 9600K | 450 | 2603 | 20.70fps | 9.46fps | 132W |
| Ryzen 9 5950X | 650 | 10240 | 69.56fps | 29.82fps | 259W |
| Ryzen 9 5900X | 638 | 8564 | 60.49fps | 25.42fps | 219W |
| Ryzen 7 5800X | 625 | 6185 | 43.72fps | 19.41fps | 214W |
| Ryzen 5 5600X | 597 | 4446 | 31.43fps | 14.35fps | 148W |
| Ryzen 9 3950X | 514 | 9249 | 64.73fps | 25.59fps | 296W |
| Ryzen 9 3900XT | 538 | 7101 | 51.91fps | 20.49fps | 221W |
| Ryzen 9 3900X | 514 | 7032 | 51.80fps | 20.29fps | 228W |
| Ryzen 7 3800XT | 540 | 5164 | 37.14fps | 15.83fps | 177W |
| Ryzen 7 3700X | 494 | 4730 | 35.05fps | 14.67fps | 152W |
| Ryzen 5 3600X | 490 | 3705 | 27.54fps | 11.81fps | 149W |
| Ryzen 3 3300X | 503 | 2577 | 18.89fps | 8.25fps | 120W |
| Ryzen 3 3100 | 449 | 2328 | 17.32fps | 7.44fps | 118W |
| Ryzen 7 2700X | 408 | 3865 | 27.31fps | 10.04fps | 224W |
| Ryzen 5 2600 | 399 | 2810 | 20.39fps | 7.09fps | 130W |
The Handbrake encoding results show a similar dichotomy, with the 11600K getting a 17 per cent advantage over the 10600K but the 11900K losing nearly eight per cent. Given it only has eight cores instead of ten, that's not a terrible result by any means, but it does suggest that the 10th-gen part is a better option for someone that's primarily interested in workloads that peg every core to 100 per cent.
It's interesting to see how the 11600K and 11900K fit within AMD's results too. The 11600K is in line with the Ryzen 5600X in these two tests, but the Intel chip does consume significantly more power (233W vs 148W) with Multi Core Enhancement enabled and falls behind AMD with it disabled. (These power measurements are made at the wall, and with different motherboards, but we expect that the vast majority of the difference there is down to the chip rather than the motherboard.)
The 11900K, meanwhile, most closely resembles the Ryzen 7 5800X, narrowly leading in Cinebench and the HEVC encode but falling behind in the h.264 task. The Ryzen 9 5900X, AMD's 12-core competitor to the eight-core i9, holds nearly a 40 per cent lead in Cinebench and a 30 to 40 per cent advantage in Handbrake, depending on the codec used. Despite this, the Intel system's peak power draw at the wall was 390W, nearly 80 per cent higher than the 219W we measured from the AMD system at its peak. (The 11900K system drops to 313W when Intel's power targets are followed, but performance also drops by around 10 to 25 per cent.)
So - some good news in that Intel's 11th-gen chips definitely show an IPC advantage over their predecessors, but AMD's results in content creation remain industry-leading. AMD has a more tenuous grasp on gaming, so let's head there now.
We tested the new chips, their predecessors and AMD's closest competitors in nine titles here, including six games that are new to our CPU test suite, and we've also taken a brief look at memory bandwidth and Intel Adaptive Boost in separate pages. Choose your adventure from the options below, or simply click on the Next button to move onwards.
Intel Core i9 11900K and Core i5 11600K analysis
- Introduction, hardware breakdown, test system [This Page]
- Gaming benchmarks: Flight Simulator 2020, Hitman 3, Total War Three Kingdoms
- Gaming benchmarks: CS:GO, Rainbow Six Siege, Black Ops Cold War
- Gaming benchmarks: Cyberpunk 2077, Far Cry 5, Crysis 3
- Gaming benchmarks: Memory bandwidth analysis
- Gaming benchmarks: Intel Adaptive Boost analysis
- Intel Core i9 11900K and Core i5 11600K: the Digital Foundry verdict