Intel Core Ultra 9 285K and Ultra 5 245K review: gaming losses, content creation wins
Less power, less powerful, more potential?

This feels like a rebuilding year for Intel. With AMD's Ryzen processors going from strength to strength and thermal degradation issues dogging Intel's last desktop CPUs, Team Blue has unveiled a new tile-based architecture for both mobile CPUs (Lunar Lake) and desktop CPUs (Arrow Lake S). Lunar Lake arrived to generally positive reviews, with excellent power efficiency, AI hardware support and reasonable performance, so can the new Core Ultra 200S desktop chips pull off the same trick?
To find out, we've tested the Core Ultra 9 285K and Ultra 5 245K, which Intel promises offer ballpark similar gaming performance and improved content creation performance versus existing 14th-gen parts while delivering significantly better power efficiency. The bulk of our review focuses around exactly how close the 285K and 245K can get in terms of game benchmarks - with 11 games in our burgeoning new test suite! - but we've also tested video production and 3D modelling workloads alongside some basic power analysis.
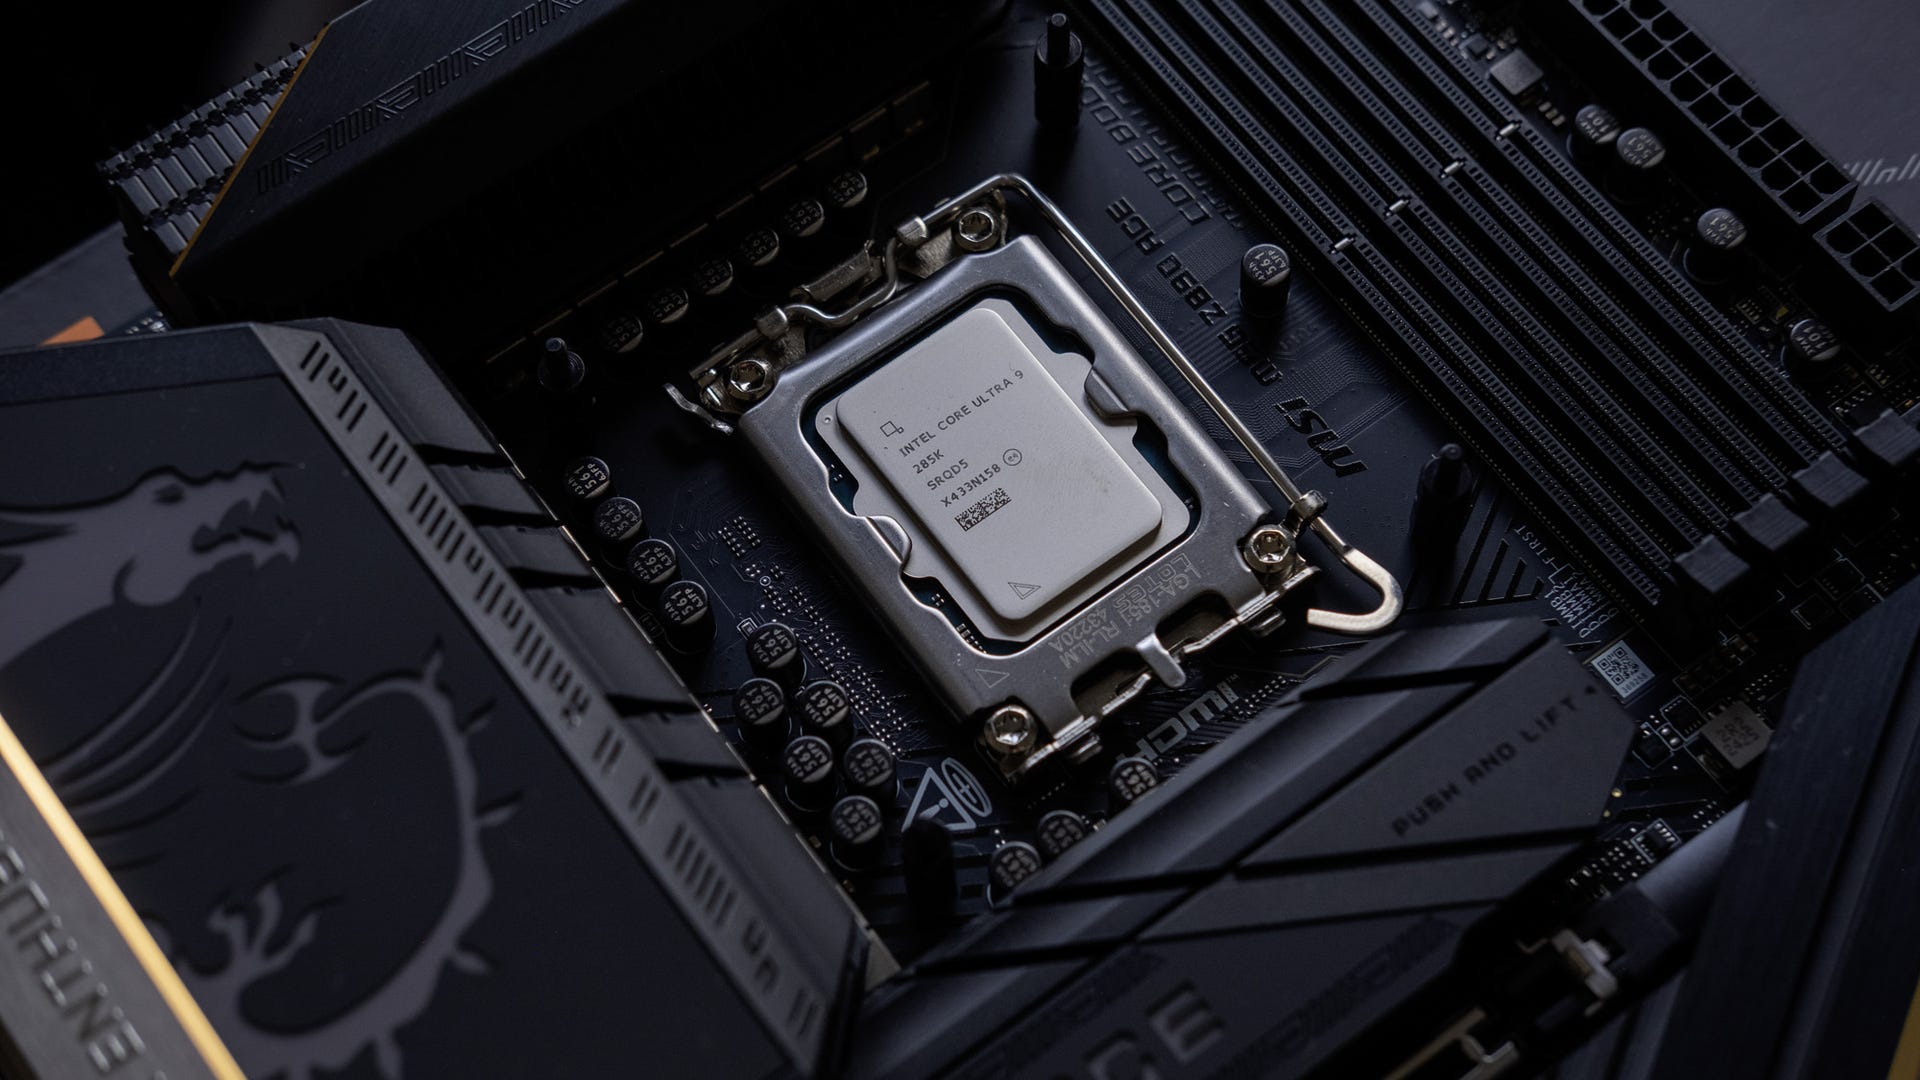
These new Core 200S processors also come with a new desktop socket, LGA 1851, and a new series of motherboards, starting with the Z890 chipset. MSI and Asus have both provided high-end boards for testing, which we'll cover briefly, but the main thing to know is that existing LGA 1700 coolers are compatible with the new motherboards, they feature more PCIe bandwidth and support memory overclocking up to DDR5-9200. Thunderbolt 4 and WiFi 6E is required and WiFi 7 and/or Thunderbolt 5 is to be expected on most high-end boards, alongside up to 10-gig wired networking.

| CPU Cores | Boost | L3 Cache | L2 Cache | Max Power | RRP | |
|---|---|---|---|---|---|---|
| Ultra 9 285K | 24 (8P + 16E) | 5.7GHz | 36MB | 40MB | 250W | $589 |
| Ultra 7 265K | 20 (8P + 12E) | 5.5GHz | 30MB | 36MB | 250W | $394 |
| Ultra 7 265KF | 20 (8P + 12E) | 5.5GHz | 30MB | 36MB | 250W | $379 |
| Ultra 5 245K | 14 (6P + 8E) | 5.2GHz | 24MB | 26MB | 159W | $309 |
| Ultra 5 245KF | 14 (6P + 8E) | 5.2GHz | 24MB | 26MB | 159W | $294 |
Before we get into our results, let's briefly cover off the spread of the field. Arrow Lake S includes five SKUs at present, from the top-of-the-line Ultra 9 285K - similar to the Core i9 tier from previous generations - to the mid-range Ultra 5 245K, which compares to previous Core i5 products. There are -F variants, denoting no onboard graphics capabilities, but an NPU for accelerating AI workloads is included across the stack.
Interestingly, the 285K has 24 cores - including 8 high-performance P-cores and 16 high-efficiency E-cores - with only 24 threads, as simultaneous multi-threading (SMT, aka hyperthreading) has been dropped with the new architecture. That means the 285K is competing against a significantly higher thread part in the 32-thread 14900K, and the same goes for the Ultra 5 and Ultra 7 models.
Elsewhere, base P- and especially E-core clock speeds are up across the board versus 14th-gen - though P-core boost clocks are lower, RAM up to DDR5-6400 is supported without overclocking and caches are slightly larger too. The main compute tile is produced using a TSMC N3B process, versus Intel's 10nm Intel 7 process for 14th-gen, so we'd generally expect better power efficiency. However, memory fabric and controllers have been shifted off-chip, which imposes a latency penalty that may be felt in gaming.


Our test system for the 285K and 245K is based around MSI's flagship Z890 MEG Ace motherboard, with supplementary testing on Asus' beautifully premium ROG Strix Z890-F Gaming WiFi. We tested with Trident Z5 Neo DDR5-6000 CL30 RAM, an NZXT Kraken Elite 360mm AiO and an NZXT C1200 Gold ATX 3.1 1200W power supply. Our graphics card is the Nvidia GeForce RTX 4090 Founders Edition, while storage duties are handled by the 2TB Samsung 990 Evo Plus and the 4TB WD Blue SN5000 PCIe 4.0 NVMe SSDs.
To put our Intel Core 200S results into context, we also have 12th-gen and 14th-gen Intel chips tested on the Gigabyte Aorus Z790 Master with the same RAM, Ryzen 7000 and 9000 chips tested with the ASRock X670E Taichi motherboard and the same RAM, and Ryzen 5000 chips tested with the Asus ROG Crosshair 8 Hero with Trident Z Royal DDR4-3600 CL16 RAM.
All testing was performed on fresh installs of Windows 24H2 with the latest chipset drivers, BIOS updates (1A14U6 for the MSI MEG Z890 Ace) and graphic drivers (Nvidia 565.90) installed. Core isolation was enabled throughout. "Intel Default Settings" were used for the bulk of our 245K and 285K testing, with "MSI Unlimited Settings" results marked as appropriate. On our 12th-gen board, Asus' "Intel Default" option was set to "Disabled" rather than "Performance" or "Extreme". As all data is fresh on the recently released 24H2, performance here isn't comparable to our Ryzen 9000X/9950X reviews, for instance.

We'll start with the results of our content creation benchmarks. These ought to map out the maximum increases to single and multi-core grunt, and of course are a good indicator of performance in other non-gaming workloads.
The 285K and 245K start promisingly in Cinebench, a popular synthetic benchmark designed to imitate the workload of 3D modelling and animation program Cinema4D. In the 2024 version of the test, the 285K scores the highest single (144) and multi-core (2386) results we've ever recorded, narrowly beating out the 9950X (138/2235) and 14900K (133/2107). Adopting the "MSI Unlimited" power profile raises these results slightly.
The 245K also ranks reasonably high, with a 128/1435 scoreline for Cinebench R2024 that puts it just ahead of the Core i5 14600K (120/1400) and Ryzen 7 9700X (130/1172).
| Cinebench | 2024 (1T) | 2024 (MT) | R20 (1T) | R20 (MT) |
|---|---|---|---|---|
| Core i5 14600K | 120 | 1400 | 777 | 9420 |
| Core i7 14700K | 127 | 1987 | 818 | 13614 |
| Core i9 14900K | 133 | 2107 | 875 | 15297 |
| Ultra 5 245K | 128 | 1435 | 841 | 9864 |
| Ultra 9 285K | 144 | 2386 | 895 | 16055 |
| Ultra 9 285K (Unlimited) | 145 | 2416 | 896 | 16478 |
| Ryzen 5 3600X | 77 | 578 | 485 | 3654 |
| Ryzen 7 5800X3D | 95 | 915 | 546 | 5746 |
| Ryzen 9 5900X | 98 | 1171 | 610 | 8393 |
| Ryzen 5 7600X | 114 | 845 | 744 | 5814 |
| Ryzen 7 7700X | 118 | 1127 | 758 | 7609 |
| Ryzen 7 7800X3D | 112 | 1074 | 688 | 6988 |
| Ryzen 9 7900X | 116 | 1605 | 776 | 11196 |
| Ryzen 9 7950X | 121 | 2004 | 784 | 14272 |
| Ryzen 5 9600X | 132 | 935 | 850 | 6358 |
| Ryzen 7 9700X | 130 | 1172 | 862 | 7851 |
| Ryzen 9 9900X | 135 | 1784 | 879 | 12617 |
| Ryzen 9 9950X | 138 | 2235 | 866 | 15850 |
Handbrake is a slightly more real world test, as we use its video transcoding functions for each video we produce. We're actually transcoding a Patreon sample of Rise of the Tomb Raider here, but the only thing you really need to know is that it's an 823MB file being transcoded with the Production Quality Standard (CRF 18) preset using the x264 and x265 (HEVC) formats.
Here, the 9950X comes in at the top slot, but the Ultra 9 285K in its MSI Unlimited power mode is able to effectively equal it at 103fps for H264 and come in just behind at 40fps for H265 versus 45fps for the 9950X.
At its default power levels, the results are more modest - 97fps on H264 and 38fps on H265, putting it a touch behind the Ryzen 9 7950X but ahead of the 14900K at 85/35. That's with the 286K drawing significantly less power - 362W max versus 476W max on the 14900K - though the Unlimited mode on the 285K does draw up to 423W.
| Handbrake | H264 (fps) | HEVC (fps) |
|---|---|---|
| Intel Core i5 14600K | 59.42 | 25.39 |
| Intel Core i7 14700K | 80.26 | 31.07 |
| Intel Core i9 14900K (476W max) | 85.06 | 35.08 |
| Intel Ultra 5 245K (286W max) | 61.05 | 26.88 |
| Intel Ultra 9 285K (362W max) | 97.17 | 38.44 |
| Intel Ultra 9 285K (Unlimited, 423W max) | 103.15 | 39.81 |
| Ryzen 5 3600X | 26.66 | 10.80 |
| Ryzen 7 5800X3D | 42.00 | 18.71 |
| Ryzen 9 5900X | 57.59 | 23.83 |
| Ryzen 5 7600X | 41.29 | 18.31 |
| Ryzen 7 7700X | 53.27 | 23.65 |
| Ryzen 7 7800X3D | 49.63 | 21.54 |
| Ryzen 9 7900X | 78.35 | 32.59 |
| Ryzen 9 7950X | 98.58 | 41.68 |
| Ryzen 5 9600X | 42.51 | 19.77 |
| Ryzen 7 9700X | 51.80 | 23.79 |
| Ryzen 9 9900X | 82.96 | 35.33 |
| Ryzen 9 9950X | 103.25 | 44.97 |
It's a promising start for the 285K in particular, with clear potential for content creators that need to chew through 3D renders and video transcodes at maximum speed - while consuming less power than the Core i9 14900K.
Now let's get into the soy protein of our testing, the gaming benchmarks. We have 11 games in all, plus additional tests examining power usage, and the impact of DDR5 speeds and core isolation.
Intel Core Ultra 9 285K and Ultra 5 245K analysis
- Introduction, test rig and content creation benchmarks [this page]
- Gaming benchmarks: Dragon's Dogma 2, Baldur's Gate 3, Starfield
- Gaming benchmarks: Flight Simulator 2020, F1 24, Forza Horizon 5
- Gaming benchmarks: Counter-Strike 2, Cyberpunk 2077, Crysis 3 Remastered
- Gaming benchmarks: Far Cry 6, Hitman World of Assassination
- Power analysis: Counter-Strike 2, Far Cry 6, Forza Horizon 5
- RAM gaming benchmarks: Cyberpunk 2077, Far Cry 6, Flight Sim 2020
- Intel Core Ultra 9 285K and Ultra 5 245K: the Digital Foundry verdict